Talos Kubernetes - Deploy Metrics, Logging, and Alerts
Prerequisite
Talos Kubernetes - Add External-Secrets.
This deployment will need to pull API keys and tokens into a nested go template, so we need to be able to extract multiple keys and values from secrets stored in a secret manager. Follow the prerequisite and then do the instructions in the tip at the bottom to ensure your secrets get updated when they are changed in Bitwarden.
Metrics and Logging
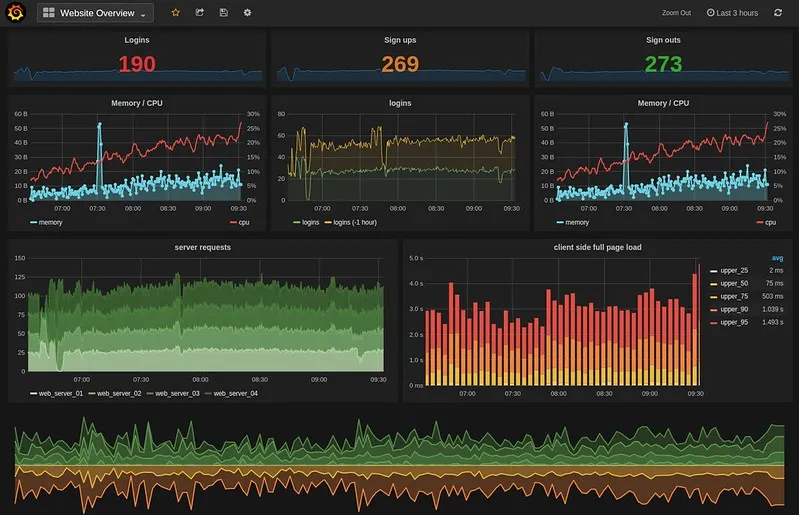
Since we’re already running a variety of apps and we plan to add more, it’s a good idea to record metrics to keep and eye on the overall health of the cluster. We will be using Prometheusfor metrics, Lokifor logging, and Grafana to explore and visualize data from Prometheus and Loki.
Here are some brief definitions of each tool as described by Grafana Labs:
Prometheus: “Prometheus is a technology that collects and stores time series data.”
Loki: “Grafana Loki is a set of open source components that can be composed into a fully featured logging stack.”
Grafana: “Grafana open source software enables you to query, visualize, alert on, and explore your metrics, logs, and traces wherever they are stored.”
Other considerations
It’s common practice in production environments to use scalable long-term storage tools like Grafana Mimiror Thanosalongside Prometheus, but for now I will leave these outside the scope of this homelab setup.
Alerting
Prometheus handles alerts via Alertmanager. We can configure Alertmanager to send heartbeats on an interval to let us know if the cluster is unhealthy, and we can define custom alerts to trigger on any number of circumstances.
healthchecks.io: I use healthchecks.io for my heartbeats. They offer a free forever Hobbyist plan that is good enough for my use case. Create a project, add a check, and pass the Ping URL into Alertmanager and you’re done. Checks can be integrated with Slack, Email, Discord, PagerDuty, Pushover, and more. I integrate my check with Pushover since I’ll be using that for all other Alertmanager alerts.
Pushover: I configured Alertmanager to use Pushoverto send push notifications to my phone for any severe or critical alerts. They offer a 30-day free-trial then it’s a 5$ one time payment per device. At the time of writing I’m still evaluating the trial.
Other considerations
Some people prefer their notifications to go to Slack or Discord (both integrate with Alertmanager) so that all of their communications are in a single application. Personally, I prefer to separate the alerting task into its own app so I don’t have to search multiple channels to find out if there is an alert or if someone posted a meme.
Instructions
- Clone my repo if you haven’t and navigate to
/kubernetes/appsin a file explorer or terminal. - Copy the
grafana,kube-prometheus-stack, andlokifolders into your project’s/apps/observabilitydirectory. - Add the ks.yaml paths for each app to the
/observability/kustomization.yaml
  - ./grafana/ks.yaml
  - ./kube-prometheus-stack/ks.yaml
  - ./loki/ks.yaml
-
- From my repo, copy
grafana.yamlfromkubernetes/flux/repositories/helm/into the same path in your project.
- From my repo, copy
- In the same directory, add the following line to the
kustomization.yamlfile:- ./grafana.yaml - Modify
kube-promeheus-stack/helmrelease.yamlto set storage, requests, limits, endpoints, intervals, etc. based on your needs. - Modify
kube-promeheus-stack/externalsecret.yamlto configure your receiver of choice. You can use kubesearch (search for kube-prometheus-stack) to find other examples. I will continue with my setup for this example. - Navigate to healthchecks.io and setup a new project. You can edit the example check or add a new one.
- Grab the ping url for the check and save it in Bitwarden Secrets Manager under the current cluster project. Name the secret ‘alertmanager’. The value should be in the form of:
ALERTMANAGER_HEARTBEAT_URL: <https://hc-ping.com/<your-heartbeat-check>Select ‘Save’. - Integrate the check with Pushover. On healthchecks.io go to Integrations then find Pushover and subscribe to it. Fill out the necessary information to sign up for Pushover, then when you’re done set the integration in the check.
- Register your applicationon Pushover to get an API token. Save this value in the same ‘alertmanager’ secret as above as valid json. It should look like this:
{
  "ALERTMANAGER_HEARTBEAT_URL": "<https://hc-ping.com/<your-heartbeat-check>",
  "ALERTMANAGER_PUSHOVER_TOKEN": "<your-pushover-api-token>"
}
Select ‘Save’.
10. Grab your Pushover user key from the Pushover homepage and put it in a secret named ‘pushover’. The value should be in the form of:
PUSHOVER_USER_KEY: <your-pushover-user-key>. Select ‘Save’.
11. Create a new feature branch and commit your changes to it, then push to git. Go to your repo in github and select ‘compare & pull’ to create a pull request for the new branch.
12. Wait for the github actions to run the flux diff checks. You might get an error: argument list too long for the ‘ad-pr-comment’ action since this flux diff is quite large. It should be safe to manually merge this commit in if this is the only failure.
13. Then, delete the feature branch you created.
14. Make sure to checkout the main branch locally if you are still on the local feature branch.
15. Once on main, fetch the changes from origin/main (remote branch). Then pull the changes to update your local main branch.
16. Assuming you didn’t make a typo in your secrets everything should come online in a few minutes. Navigate to grafana.$(SECRET_DOMAIN) and start poking around with your new dashboards.
17. Download the Pushover client (mobile or desktop) and start the free trial.
18. If everything works in your cluster you won’t see any alerts, but you can curl a heartbeat failure to test Pushover:
curl --retry 3 https://hc-ping.com/<your-heartbeat-check>/fail
19. A notification should appear on your phone if you installed the pushover app and setup everything correctly.
Next
Talos Kubernetes - Deploy cloudnative-pg Database. We will use Prometheus and Grafana to visualize metrics for this new database and verify that it was installed successfully.
References
- Grafana
- Prometheus
- Lokifor logging
- Alertmanager.
- healthchecks.io.
- Pushover.
- Json validator (JSONLint.com).